Introducing Site Levels from MyNestBox

Liam Steadman
We’re thrilled to announce our latest addition to MNB Assess, Site Levels. This exciting new ‘deal breaker’ data source allows you to see the height and shape of a site more easily and much earlier in the assessment process. Being able to see the relative height at regular points across a site helps you to gauge how costly remedial work might be before ever setting foot on the site.
The goal of Site Levels is to allow quick assessments of the height of the land across a potential development. Previously, the only real way to do this was to commission a full topographical survey, which can take weeks to procure and cost well over £1,000, or get some very limited topographical data from somewhere like Google Earth.
Site Levels gives a comprehensive, detailed view of the levels across a site and its surrounding area, allowing you to assess the amount of excavation or levelling that may be needed without the wait, and with a marginal cost of zero. This means you can assess the levels of multiple sites very quickly before deciding which one(s) to progress. Though you will likely need a full topographical survey later in the process, Site Levels prevents you wasting time on unsuitable sites by getting you the core information quickly.
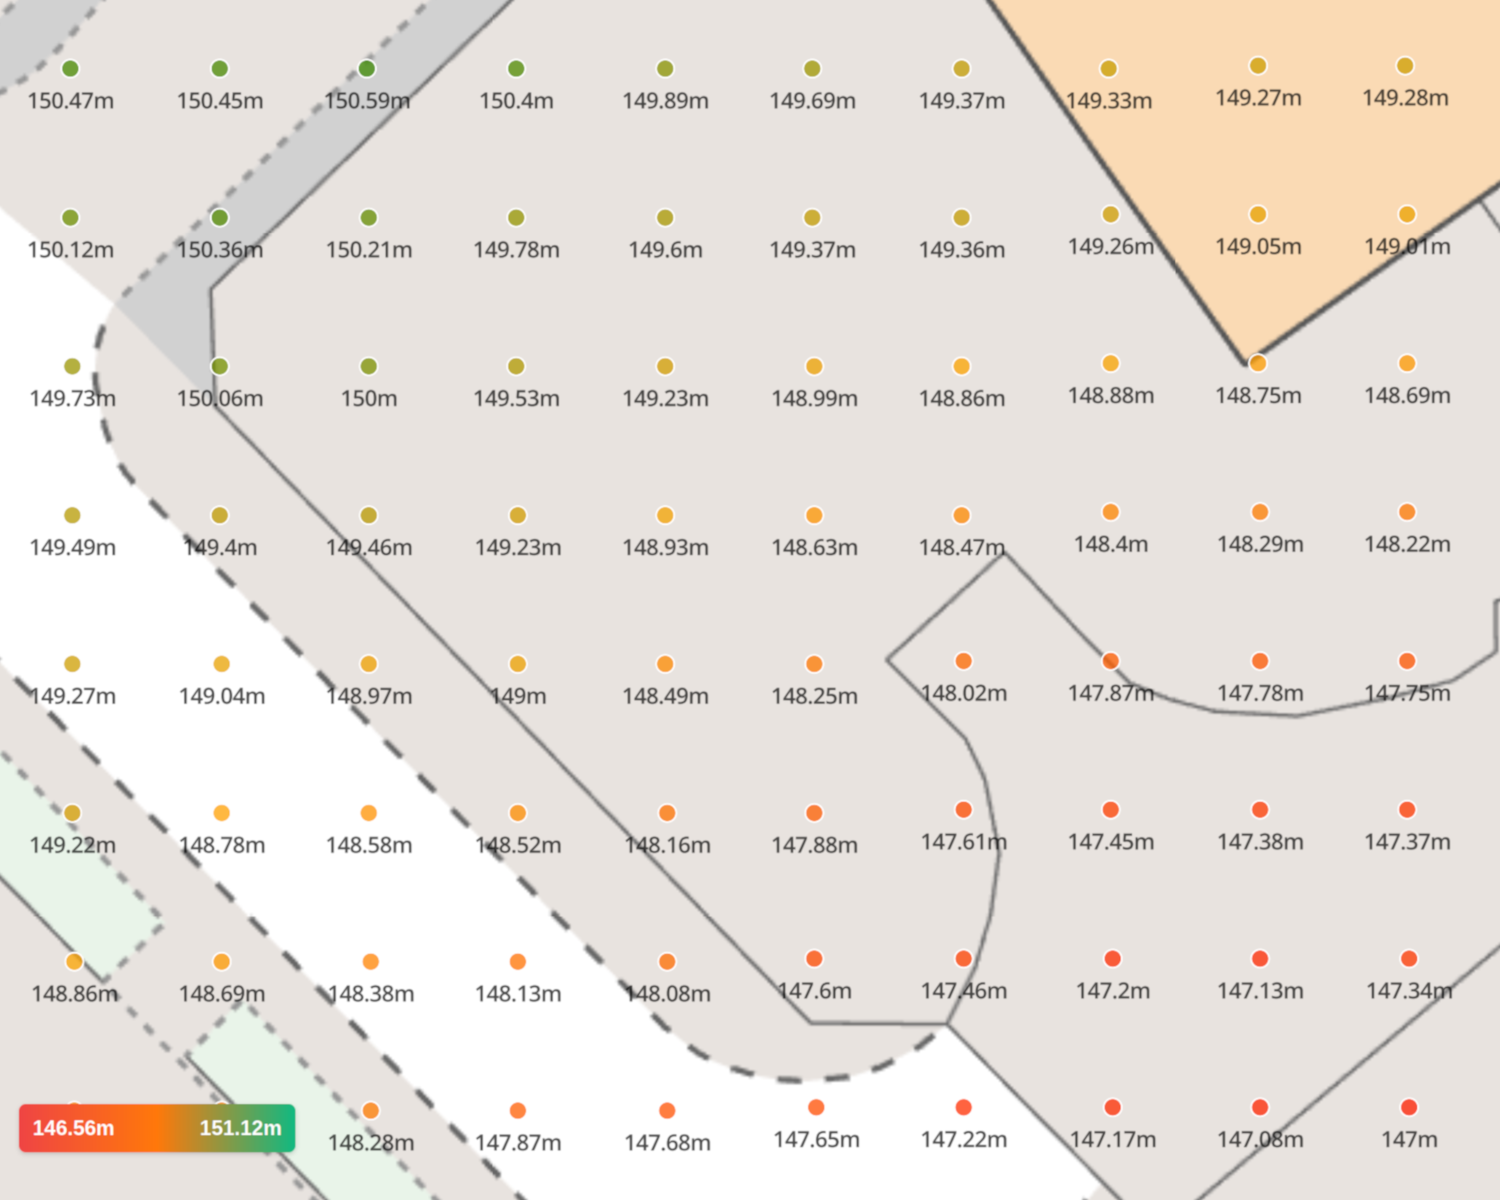
Here’s an example of Site Levels data rendered over a map of Sheffield city centre:
Contains Environment Agency data © Environment Agency 2020
As you can see, the map shows the overall shape of the land very clearly. The green points are the highest and the red points are the lowest. From this you can clearly see the ground level generally slopes left to right, and total difference is ~3 metres. Because the data is rendered over a base map we can also see that, even though this area is pretty flat, the local council might have something to say if we proposed levelling the town hall. Context matters! As you zoom in, more Site Level data gets filled in.
At the closest views, Site Level data is presented in a uniform grid, with points placed every 5 meters. Building heights and the heights of other objects (e.g. trees, vehicles etc.) are not presented – the focus in entirely on the level of the ground.
How we did it
Site Levels is underpinned by extensive LiDAR data supplied by the Environment Agency. Overhead LiDAR, or laser scanning, is data captured from aircraft flying low to the ground across England. By measuring the time it takes for laser reflections to return, incredibly accurate 3D models of England can be created.
MyNestBox takes this reflection data and turns it into over 5.5 billion data points, mapping the ground height (relative to sea level) every few meters across the whole of England. By showing you the heights of the land around each site as well, you can understand how nearby plots might impact the site you’re assessing and, at a glance, get a real sense of the shape of the land you’re looking at.
Because the underlying data is supplied by the Environment Agency (in partnership with Airbus), the rendered points are precise to within a centimetre across the whole country, making them more than accurate enough for initial site assessment purposes.
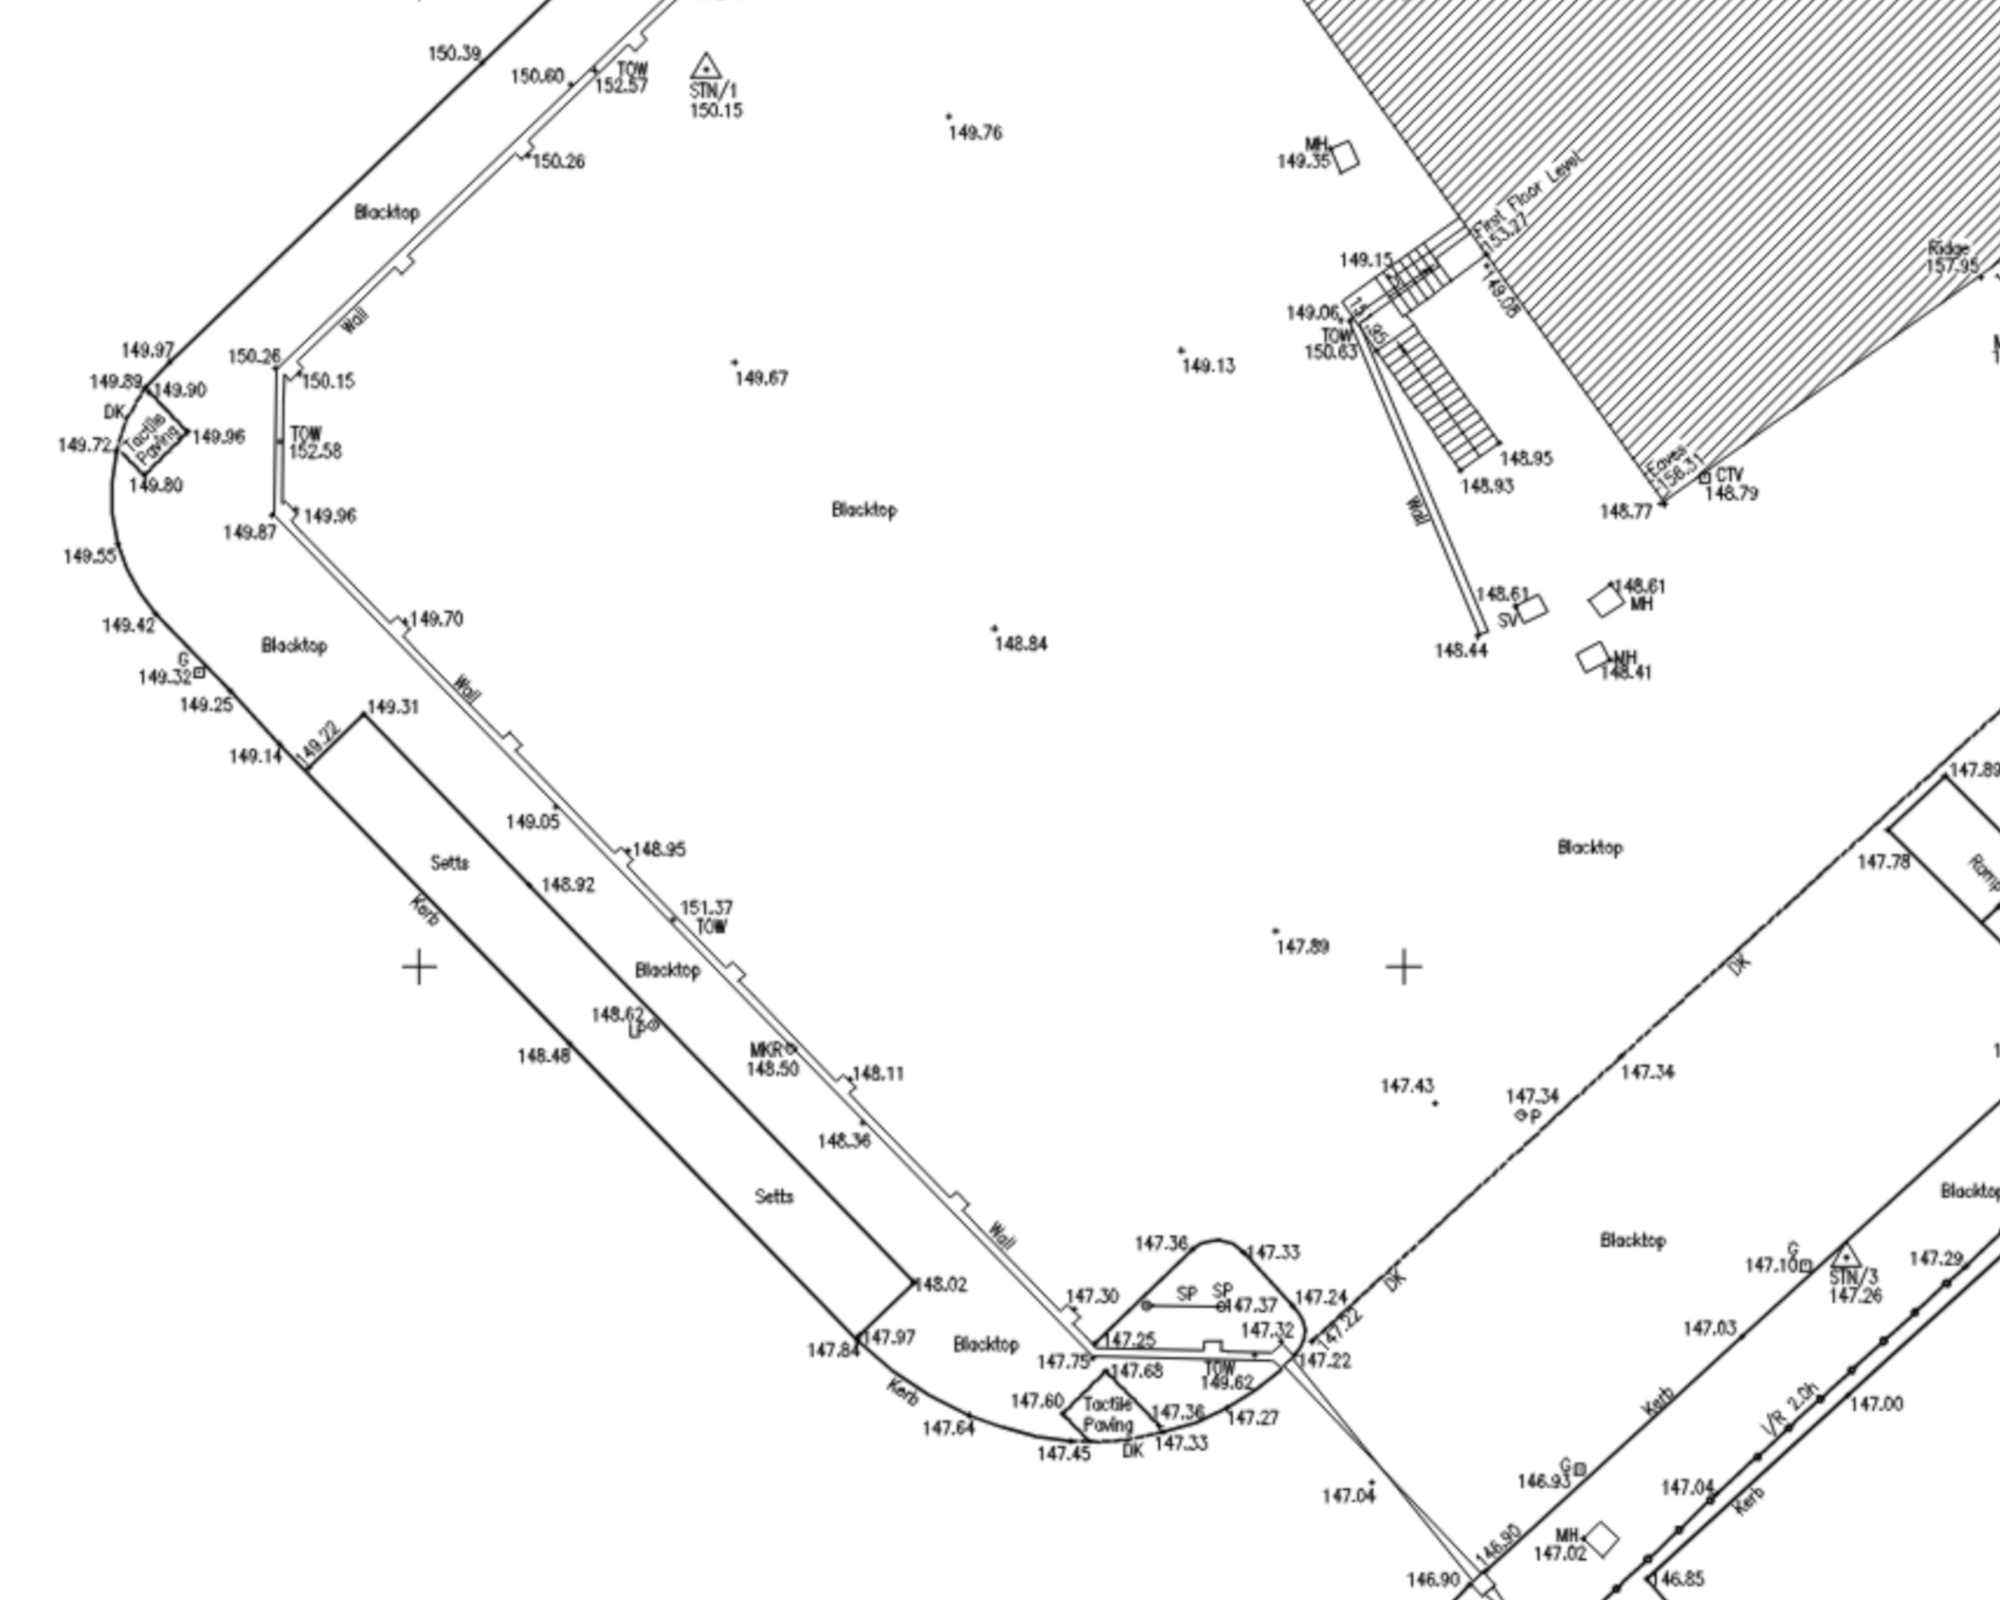
How does it Compare to a Topographical Survey?
Like our Site Levels data, topographical surveys allow you to understand how the height of a site varies across the plot. However, topographical surveys also show the height of existing buildings, walls and fences. This extra information is costly to obtain and isn’t always useful when initially assessing a site. Site Levels provides a low-cost alternative that is much easier to read, giving you the information you really need at the start of an assessment.
Below, you can see how our data compares to a typical topographical survey.
We’re really excited about the launch of this new tool. We hope it’ll be a really useful additional piece of information when assessing a site’s suitability for development. Sign up now to try it out for free.